March 26, 2017

Six Graphs that Reveal Big Problems for Student and Auto Loans
The New York Fed’s most recent household debt report showed ballooning debt and delinquency in student and auto loans. Total household debt has just about reached its previous late-2008 high of over $12.5 trillion.
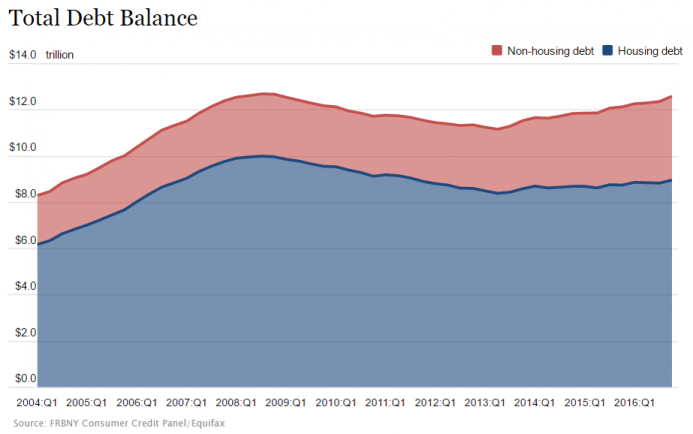
You’ll notice that housing debt (blue) has not increased much since its 2013 low, meaning that the increases in total debt have mostly come from non-housing debt (red). A closer look at the composition of non-housing debt reveals that the biggest increases in debt have come from student and auto loans (red and green, below).
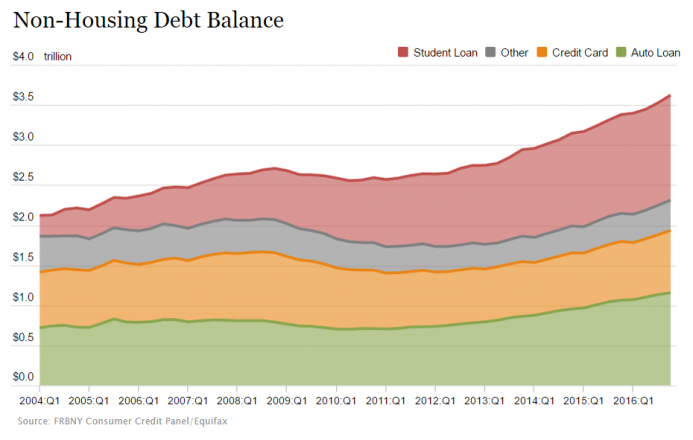
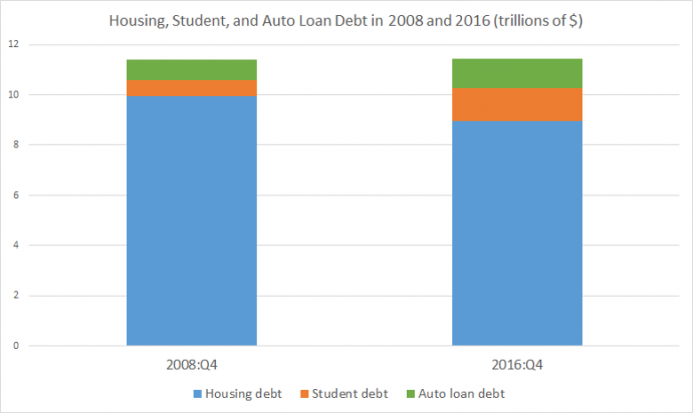
In fact, the numbers make it look like the housing bubble was almost exactly replaced by new bubbles in education and cars. From 2008 to 2016, housing debt has decreased by $1.01 trillion, while student and auto loan debt together have increased by $1.04 trillion. The Board of Governors of the Federal Reserve has an even higher estimate than the NY Fed for current student loan debt, at $1.41 trillion.
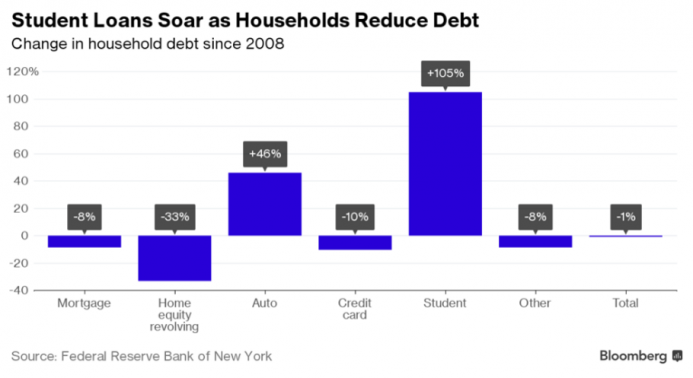
Shahein Nasiripour at Bloomberg showed the relative changes based on the same data this way:
While both student and auto loan debt have increased substantially, delinquency rates are higher for student loans. In 2012, student loan delinquency spiked up enough to claim the top spot, probably due to the number of people who chose more school over searching for employment during the bust. The graph below shows that student and auto loan delinquency rates are the only ones not decreasing.
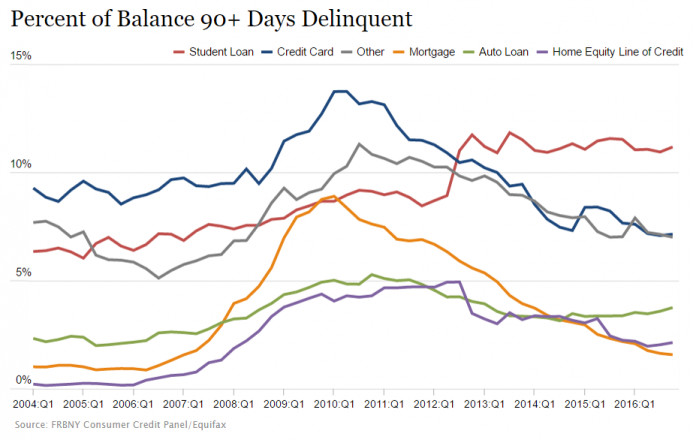
Of course, this is more of an intended feature than a flaw of the Fed’s monetary policy since the housing bubble popped. Expansionary monetary policy can only replace bubbles with new bubbles. Malinvestments are not totally liquidated, but shift from one sector to another. Consumer debt is not directly paid off, but transferred from one type to another.
The redirection is mostly guided by new government interference in markets. Pre-2008, federal government programs to encourage new housing and mortgages, along with the low interest rates and new money from the Fed, created the housing bubble. Since 2008, programs like Cash for Clunkers, auto manufacturer bailouts, and income-based student loan repayment have funneled spending, borrowing, and increasing prices into education and autos.
Some recent headlines already signal a collapse in used car prices this year. Meanwhile, college tuition increases are still the norm every year, despite the decreasing value of a diploma. According to this AP report, “the average amount owed per borrower rose to $30,650 in 2016, after rising steadily for years. In 2013, borrowers on average owed $26,300.”
Another recent release by the NY Fed contains data on labor outcomes for college graduates versus all other laborers. There have been dramatic swings in employment across the board since 2008, but comparing September 2008 to September 2016 on net, the unemployment rate for college graduates has increased while the unemployment rate for all other workers has decreased. The underemployment rate (“defined as the share of graduates working in jobs that typically do not require a college degree”) for recent graduates has hovered around 45% since 2008. An indexed measure of job postings indicates that demand for laborers with a college degree has not increased as much as demand for laborers that don’t need a college degree, though both reached a peak late 2015.
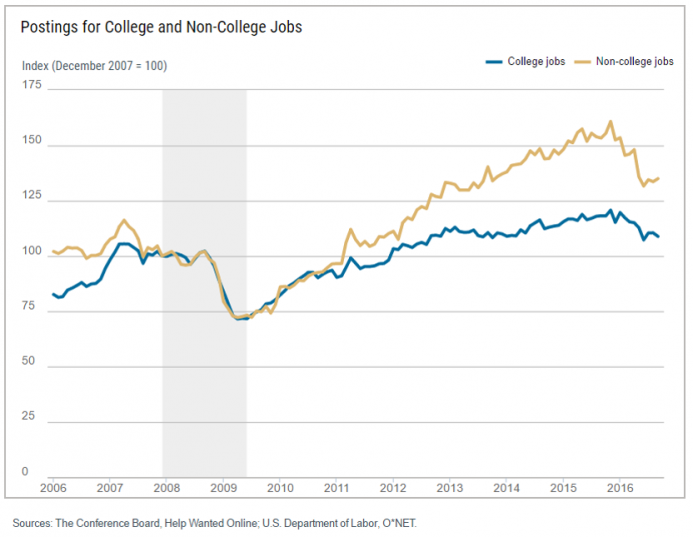
The overwhelming conclusion from all of this data is that we almost certainly have new bubbles in education and the auto industry. A trillion dollars of housing debt has been replaced by a trillion dollars (or more) of student and auto loan debt. Delinquency rates are increasing for student and auto loans, while other loan types have seen a decrease in delinquency. Finally, the value of both the university education and the automobiles people are buying don’t seem to justify the amount being borrowed and spent, from a big picture perspective. Their prices are artificially inflated due to the Fed and the federal government teaming up to create new bubbles, just like they did to create the housing bubble.
Back To Leeconomics.com
